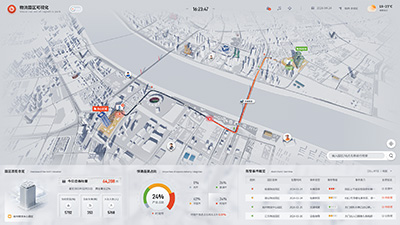
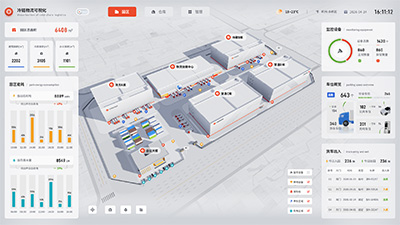
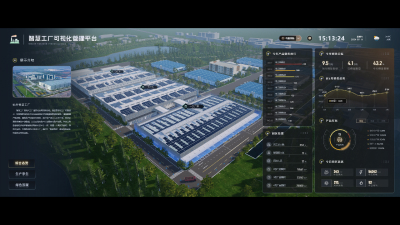
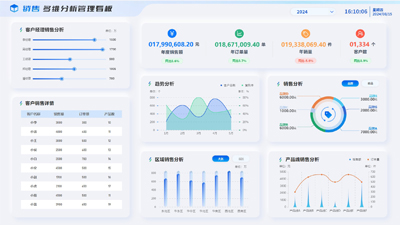
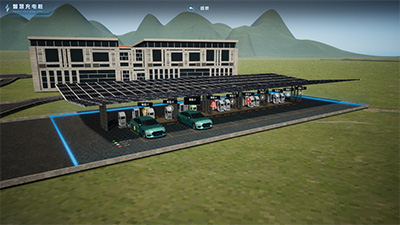
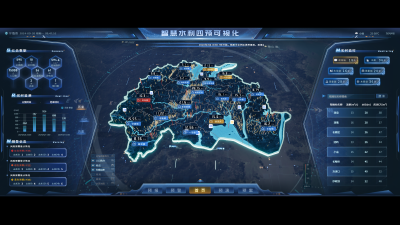
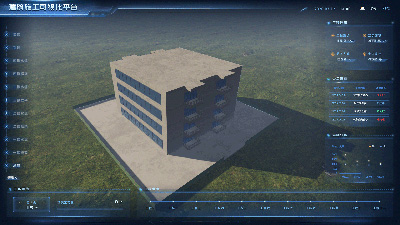
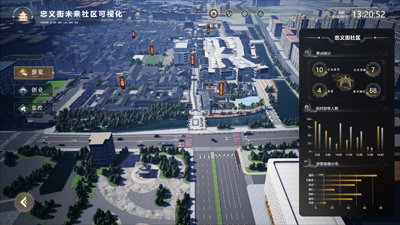
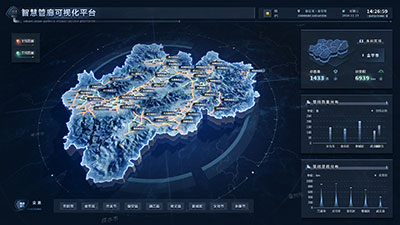
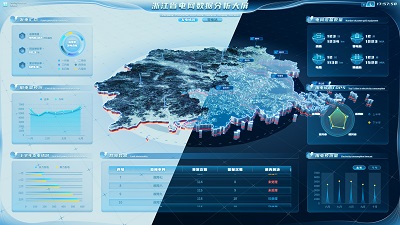
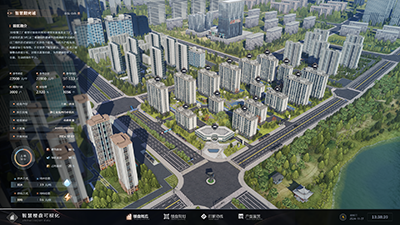
Shanghai Pudong New Area Traffic Radio Visualization Dashboard

This Dashboard uses components such as area charts, stacked bar charts, and percentage charts to analyze real-time audience numbers, audience age groups, daily listeners, and dedicated listeners. It also displays traffic conditions, congestion rates, and the public's preferred modes of travel, providing a multi-faceted view of the audience of traffic broadcasts and the traffic situation in Pudong New Area, Shanghai.
Author: Wings Engine
Ratio: 16:9
Size: 0.17MB
Updated: 2026-06-01

Notes:

1. Plan-only templates work only while the plan is active. After expiry, the project can no longer be used.

2. If you copy content from a plan-only template into another project, that project also needs the same plan.

Desktop Client
Edit locally Local & secure No browser limits Switch to LAN SaaS
Download Client