Loading video...

Domestic and International Natural Gas Pipeline Operation Data Dashboard

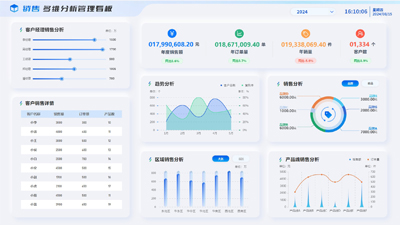
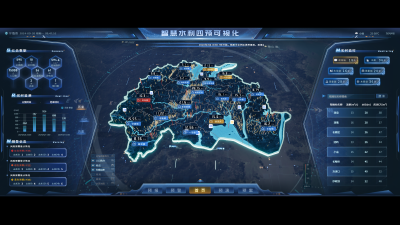
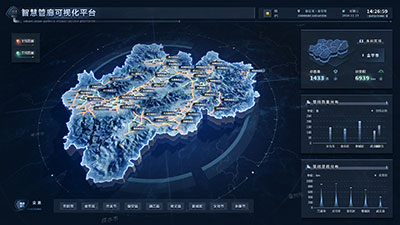
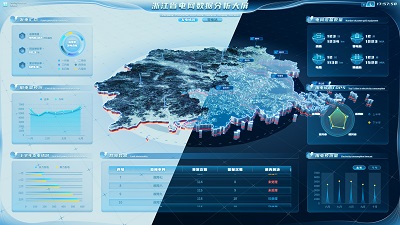
This Dashboard uses components such as percentage charts and grouped bar charts to display the usage and utilization of natural gas worldwide, analyzes the profitability of natural gas with grouped bar charts, and also provides real-time monitoring and feedback of various natural gas indicators.
Author: Wings Engine
Ratio: 16:9
Size: 17.73MB
Updated: 2026-06-01

Notes:

1. Plan-only templates work only while the plan is active. After expiry, the project can no longer be used.

2. If you copy content from a plan-only template into another project, that project also needs the same plan.

Desktop Client
Edit locally Local & secure No browser limits Switch to LAN SaaS
Download Client