Loading video...

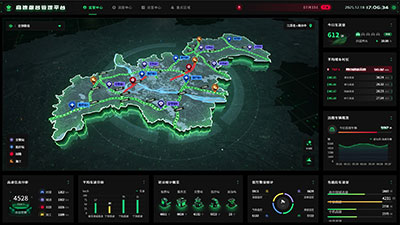
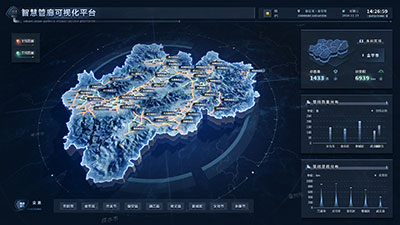
Chengdu, Sichuan Province Power Data Visualization Dashboard

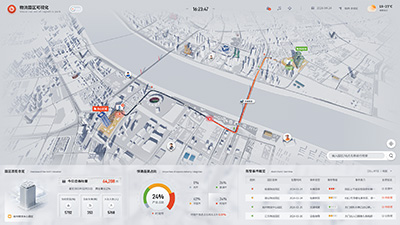
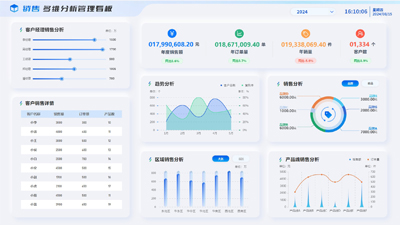
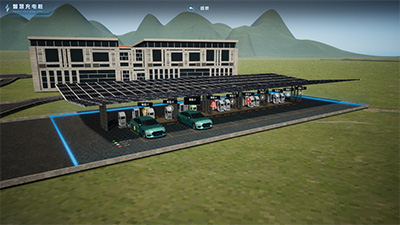
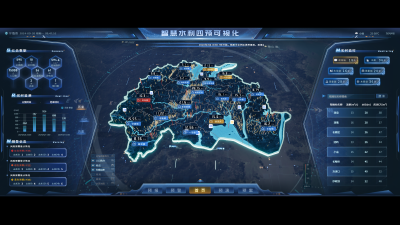
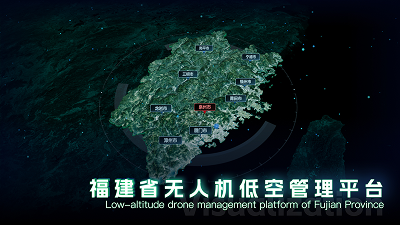
This Dashboard uses components such as 3D model maps, line charts, and data tables to display the real-time status of power data management. It analyzes various types of power generation and risk warnings. It also provides an analysis of electricity usage trends and main electricity consumption trends. Ultimately, this results in this Chengdu power data visualization screen.
Author: Wings Engine
Ratio: 64:27
Size: 21.84MB
Updated: 2025-03-17

Notes:

1. Plan-only templates work only while the plan is active. After expiry, the project can no longer be used.

2. If you copy content from a plan-only template into another project, that project also needs the same plan.

Desktop Client
Edit locally Local & secure No browser limits Switch to LAN SaaS
Download Client