Smart Industrial Farming System Data Dashboard
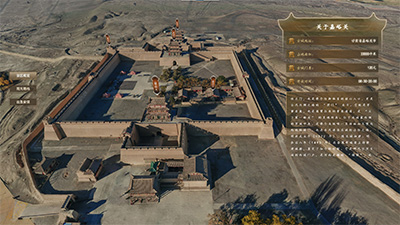
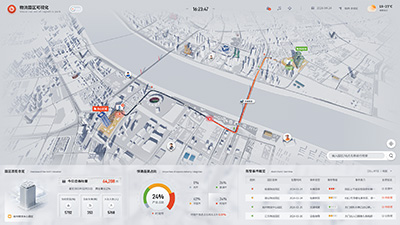
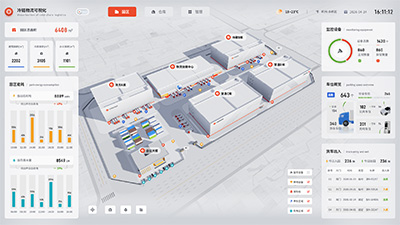
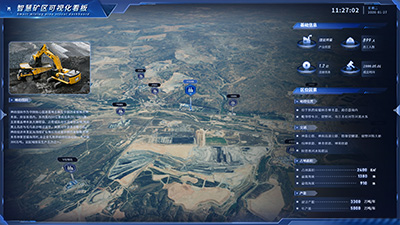
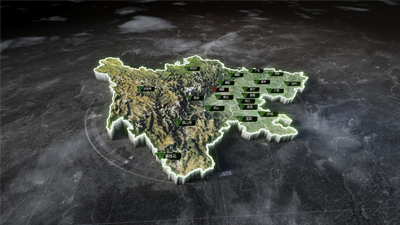
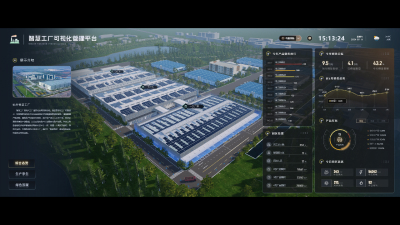
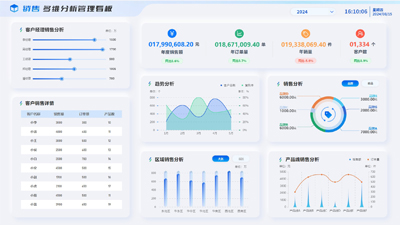
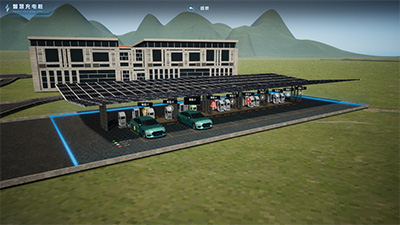
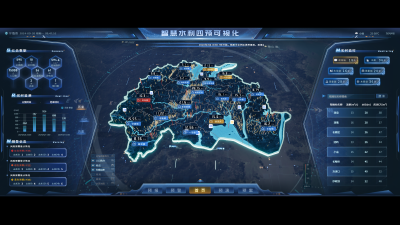
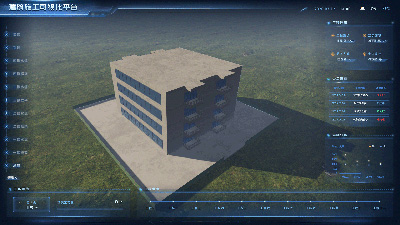
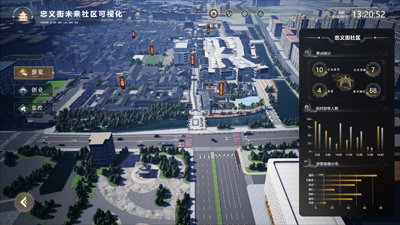
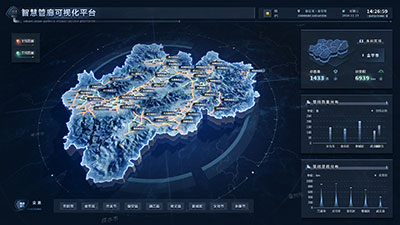
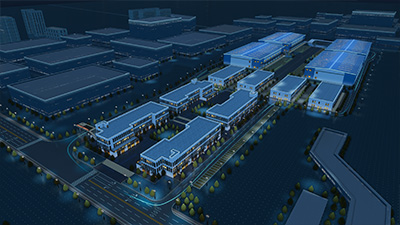
This Dashboard is themed around pig farms, presenting an industrial farming system in the form of data. It consists of four pages: breeding situation, environmental monitoring, sales transactions, and monitoring system. Among them, the breeding situation page shows the approximate data of the breeding area, using components such as percentage charts, bar charts, tables, ring charts, line charts, and indicator cards. On this page, the 3D model allows page switching through button clicks, and clicking on markers triggers pop-up effects to better display data in small areas. The environmental monitoring interface mainly displays various environmental data within the farm, using components such as images, indicator cards, dual-axis bar charts, and tables. The 3D model section intuitively represents temperature variations within the area using a heat map. The sales transaction interface mainly presents the sales data within the farm, utilizing components like indicator cards, line charts, bar charts, and column charts, with pop-up effects when clicking marker points in the 3D area. The monitoring system contains components such as ring charts, indicator cards, and tables, and the 3D section also features pop-up effects when clicking monitoring markers.
Author: Wings Engine
Ratio: 16:9
Size: 104.94MB
Updated: 2026-06-01
Notes:
1. Plan-only templates work only while the plan is active. After expiry, the project can no longer be used.
2. If you copy content from a plan-only template into another project, that project also needs the same plan.
 Desktop Client
Edit locally
Local & secure
No browser limits
Switch to LAN SaaS
 Download Client