Loading video...

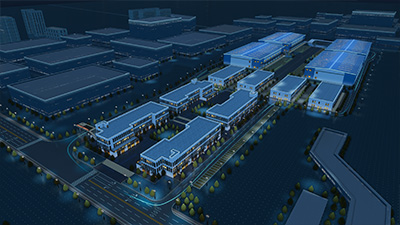
Smart Office Park Visualization

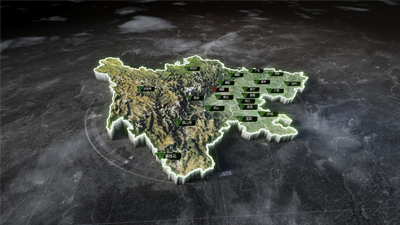
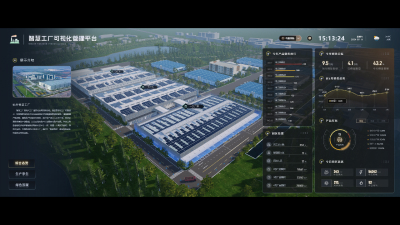
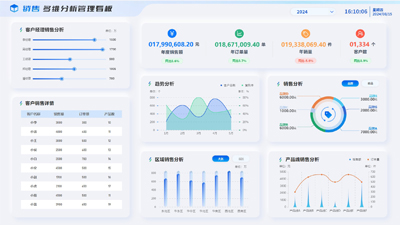
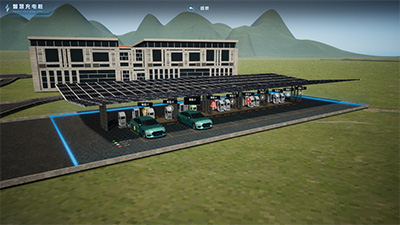
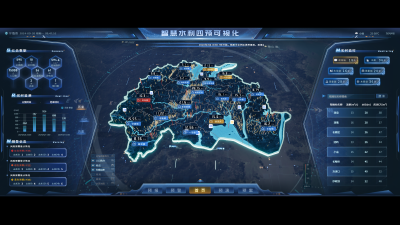
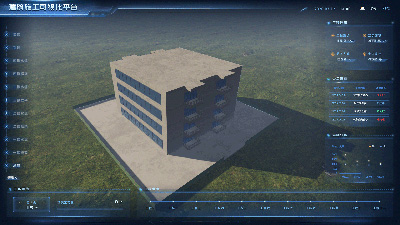
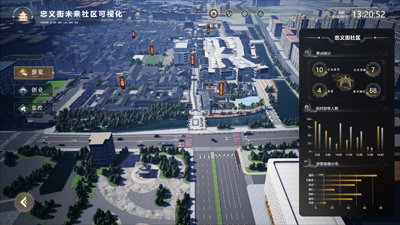
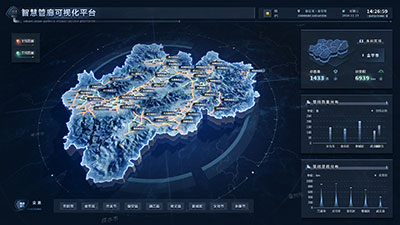
This Dashboard uses components such as 3D outdoor views, line charts, and data tables to display the real-time situation of smart office park management. It analyzes personnel category statistics and real-time vehicle occupancy rates. Additionally, it conducts analysis through average power consumption periods and project information. Ultimately, it results in a visualization of this smart office park.
Author: 山海鲸可视化
Ratio: 16:9
Size: 123.77MB
Updated: 2026-06-01

Notes:

1. Plan-only templates work only while the plan is active. After expiry, the project can no longer be used.

2. If you copy content from a plan-only template into another project, that project also needs the same plan.

Desktop Client
Edit locally Local & secure No browser limits Switch to LAN SaaS
Download Client