-
Product
Product Overview
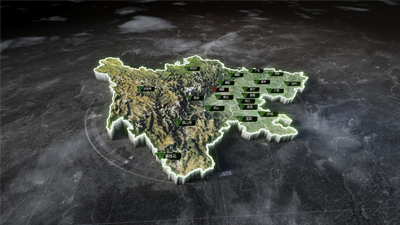
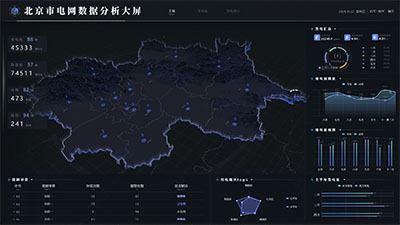
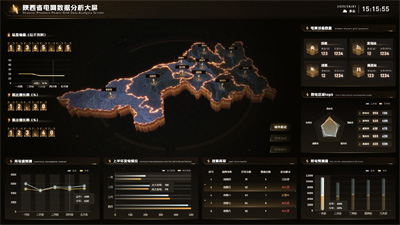
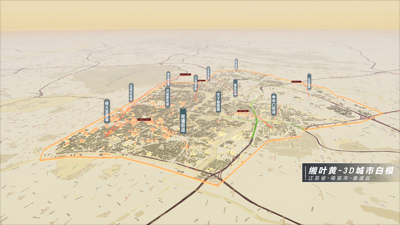
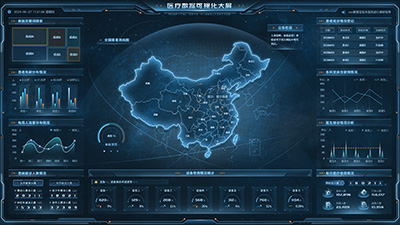
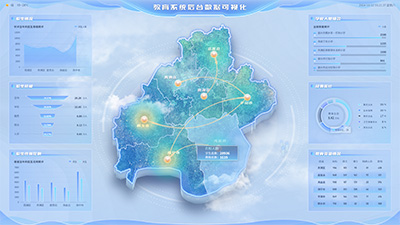
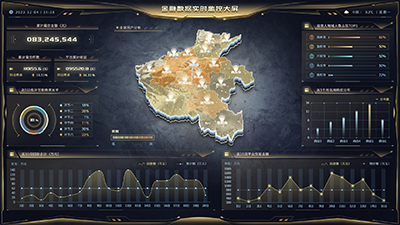
Wings Engine builds a complete data visualization product matrix, from 3D digital twins to data reporting, so teams get a one-stop experience across products and services.
{{ panel.title }}
- Custom Services
- Download
- Marketplace
- Video
- Doc


 Download Client