Loading video...

Education System Backend Data Visualization

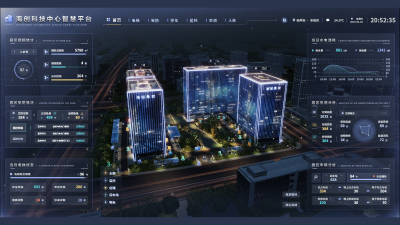
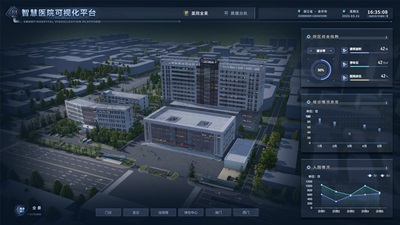
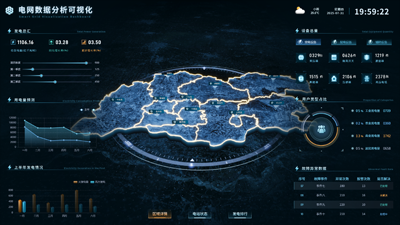
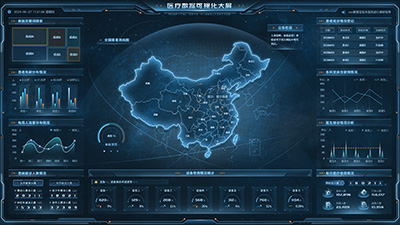
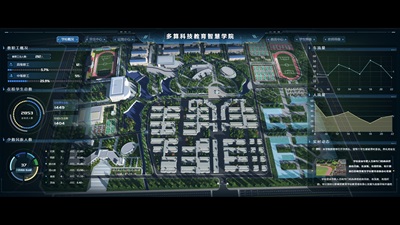
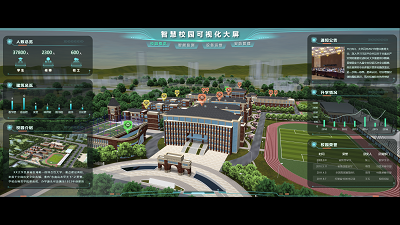
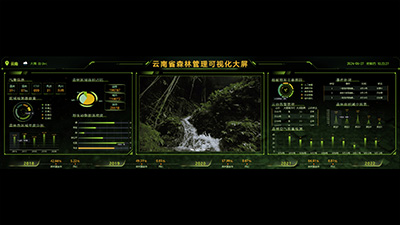
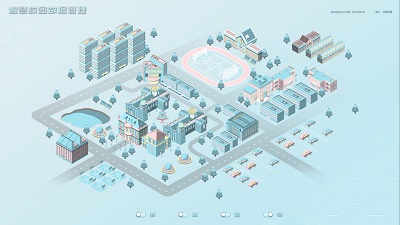
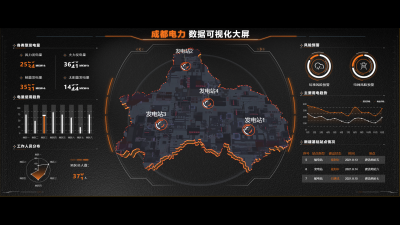
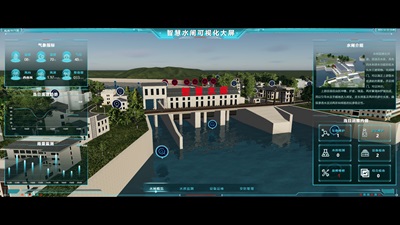
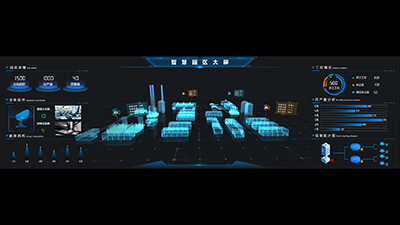
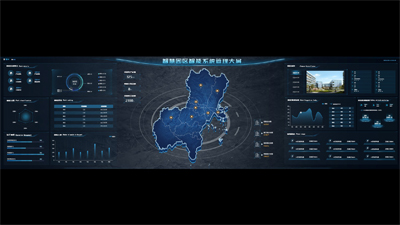
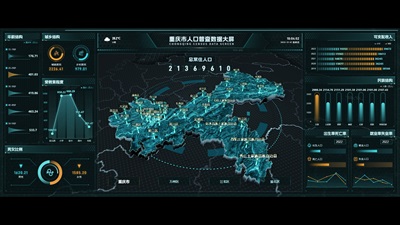
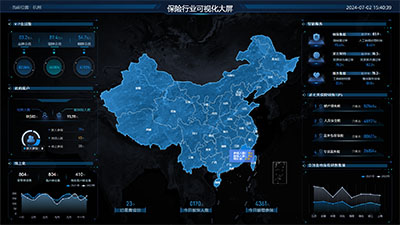
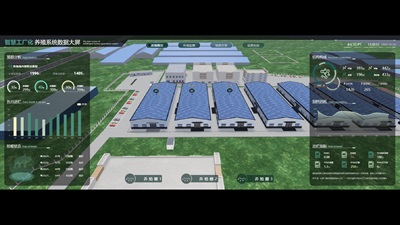
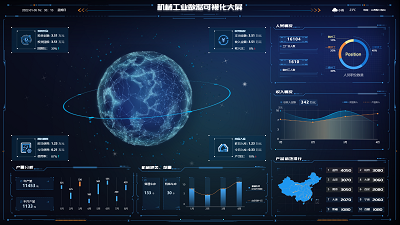
The backend data visualization of the education system mainly involves intuitively displaying the large amounts of data from educational institutions, such as enrollment situations, enrollment stages, gender ratios of enrollees, school rankings, funding statistics, and educational resource conditions, so that education administrators, teachers, and even parents can quickly understand the current situation and make efficient decisions.
Author: Wings Engine
Ratio: 16:9
Size: 5.45MB
Updated: 2026-06-01

Notes:

1. Plan-only templates work only while the plan is active. After expiry, the project can no longer be used.

2. If you copy content from a plan-only template into another project, that project also needs the same plan.

Desktop Client
Edit locally Local & secure No browser limits Switch to LAN SaaS
Download Client